

TL;DR
- SEO reporting dashboard tools consolidate rankings, traffic, backlink, and conversion data into a single client-ready view.
- Top free tools: Google Search Console (ranking and impressions), Google Analytics 4 (traffic and conversions). Essential but require manual setup and cannot produce white-labeled client reports.
- Top paid platforms: Semrush and Ahrefs for in-house teams needing deep competitive analysis; SE Ranking and AgencyAnalytics for agencies needing automated white-label client reporting at scale.
- Choosing between them comes down to one question: is the primary audience an internal analyst or an external client stakeholder? Analyst-focused tools optimize for data depth; client-focused tools optimize for comprehension and automation.
- The most important metrics to surface in any dashboard: rankings (leading indicator), organic sessions by intent segment, qualified leads from organic, and revenue attributed to the organic channel.
A ranking report is not an SEO report. Knowing that a keyword moved from position 9 to position 7 tells a client nothing about whether their SEO investment is working. It tells the analyst something interesting. It tells the CEO nothing actionable.
The gap between those two audiences, the analyst who builds the report and the executive who reads it, is where most SEO reporting systems break down. Tools built for researchers produce outputs that overwhelm non-technical stakeholders. Manual spreadsheet reports take 10-15 hours per client per month to produce and arrive looking like internal documents. Neither approach builds client confidence or justifies retainers.
This guide compares the leading SEO reporting dashboard tools available today, defines which metrics belong in client-facing reports, and outlines the implementation steps that make reporting a retention tool rather than an administrative burden.
What Is an SEO Reporting Dashboard and Why Do Agencies Need One?
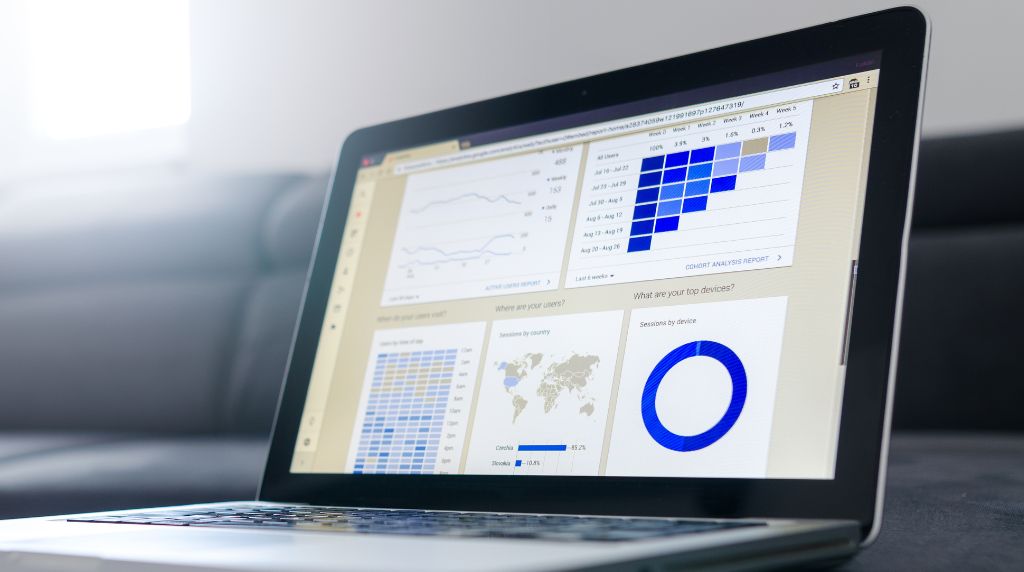
An SEO reporting dashboard is a centralized platform that aggregates data from ranking, traffic, backlink, and conversion sources into a single, real-time view. It replaces manual data collection from multiple tools with automated integration, produces client-ready visualizations, and, in the best implementations, connects search activity directly to business outcomes such as leads and revenue.
Without a dedicated dashboard, SEO agencies typically pull data from four to six separate platforms: Google Search Console, Google Analytics 4, a rank tracker, a backlink monitor, and a CRM. Manual compilation of that data into a client report takes 10-15 hours per client per month. For an agency managing 20 clients, that is 200-300 hours of reporting overhead per month, a significant cost that also introduces data inconsistency and human error.
The ROI Challenge Agencies Face Without a Dashboard
- Manual spreadsheet compilation is error-prone and produces different formatting each month, making month-over-month comparison difficult
- Clients cannot see real-time progress between monthly reports, which reduces confidence in SEO investment during months where visible results are still building
- Data scattered across five to ten platforms creates visibility gaps: a ranking improvement and a traffic increase that happened the same week look unrelated when reported from separate tools
- Without standardized KPI reporting, every month-end conversation starts from scratch instead of building on a documented baseline
Firestarter addresses this directly: every client receives 24/7 real-time dashboard access alongside custom monthly reports covering rankings, traffic, leads, and link activity, so the data is always current and the monthly report adds narrative context rather than just delivering raw numbers.
What Are the Core Features to Evaluate in SEO Reporting Tools?
The best SEO reporting dashboards combine real-time data integration from first-party sources, customizable KPI visualization, automated scheduled reporting, and conversion tracking that ties organic traffic to business outcomes. All four elements are necessary. A tool strong on visualization but weak on data integration will produce beautiful reports with unreliable numbers.
Data Source Integration: What Matters Most
Native Google Search Console integration is the minimum baseline. GSC is the authoritative source for keyword impressions, click-through rate, and position data. Any tool that requires manual CSV exports from GSC rather than a direct API connection will have stale data and will not scale beyond a handful of clients.
Beyond GSC, prioritize native Google Analytics 4 connection for traffic quality, user behavior, and conversion tracking. Backlink data from Ahrefs, Moz, or Semrush rounds out the picture. Avoid tools that require manual data uploads for any of these sources: automation is not a convenience feature, it is a reliability requirement.
Customization vs. Simplicity: Finding Your Fit
- Enterprise in-house teams need role-based access control, multi-account management, and the ability to create custom metric calculations
- Boutique agencies benefit from simplified, pre-built report templates that reduce setup time per new client
- Visual-first dashboards reduce client training time and increase engagement: a client who can read their own dashboard without a walkthrough is a more confident client
- Custom metric creation matters when client KPIs do not map cleanly to standard platform outputs, for example, when a client defines a lead as a specific form submission rather than any conversion event
How Do the Top SEO Reporting Platforms Compare?
The leading SEO reporting tools fall into two categories: full-suite analytics platforms built for analyst use (Semrush, Ahrefs, Moz Pro) and client-reporting-focused tools that prioritize automated white-label delivery (SE Ranking, AgencyAnalytics). Free tools from Google serve as the data foundation for both categories but cannot produce client-ready reports on their own.
|
Tool |
Best For |
Key Strength |
Pricing |
Limitation |
|
Google Search Console |
All teams |
Free, authoritative Google data |
Free |
No automation, no white-label |
|
Google Analytics 4 |
All teams |
Conversion and revenue tracking |
Free |
Requires configuration expertise |
|
Semrush |
In-house teams |
All-in-one suite + competitor data |
$130-500+/mo |
Complex for client-facing reports |
|
Ahrefs |
In-house teams |
Backlink research, rank tracking |
$99-449/mo |
Not designed for client reporting |
|
Moz Pro |
Agencies + in-house |
Local SEO, keyword research |
$99-599/mo |
Smaller index than Semrush/Ahrefs |
|
SE Ranking |
Budget agencies |
Rank tracking + report scheduling |
$55-239/mo |
Less depth on backlink data |
|
AgencyAnalytics |
White-label agencies |
Automated white-label dashboards |
$12-15/client |
Limited keyword research tools |
Full-Suite Platforms: Strengths and Limitations
Semrush, Ahrefs, and Moz Pro are built for the analyst who needs deep competitive intelligence, keyword research, technical audit data, and rank tracking in a single environment. They are the right choice for in-house SEO teams that also need to conduct ongoing research, not just report results.
- Strength: comprehensive data including proprietary keyword databases, site audit tools, and competitive gap analysis
- Strength: rank tracking at scale across hundreds of keywords and multiple competitors
- Limitation: pricing runs $130-500+ per month at the tiers needed for agency-scale rank tracking, which becomes expensive when the tool is being used primarily to generate client reports rather than to conduct research
- Limitation: dashboards are designed for analysts, with data density that overwhelms non-technical client stakeholders
- Best for: in-house SEO teams, agencies where the same tool serves both research and reporting needs
White-Label Reporting Specialists: Why Agencies Prefer Them
Tools like AgencyAnalytics and SE Ranking are built around the agency workflow: onboard a client, connect their data sources, generate branded reports on a schedule, and send them automatically. The trade-off is reduced depth on competitive research, which agencies typically handle in a separate tool.
- Per-client pricing models (typically $12-55 per client per month) make scaling profitable, whereas flat-fee full-suite platforms become less cost-efficient per client as client count grows
- Simplified, client-focused dashboards reduce the support questions that come from sharing analyst-grade reports with non-technical stakeholders
- White-label branding with agency logo, custom domain, and color scheme reinforces the agency relationship and makes clients less likely to compare the report to what they could build themselves
- Automated report scheduling eliminates the manual generation step: reports are built and sent on a defined cadence without agency staff involvement
- Pre-built templates for local SEO, e-commerce, and lead generation clients accelerate client onboarding from hours to minutes
Free Tools: When They Suffice and Where They Fall Short
- Google Search Console provides authoritative keyword, impression, CTR, and position data at no cost. It is the most reliable source of organic search data available and should be connected to any paid tool rather than replaced by it.
- Google Analytics 4 tracks traffic, user behavior, and conversion data but requires proper event configuration and attribution setup to produce meaningful conversion reports
- Limitation: neither tool produces automated, white-labeled, client-facing reports. Manual report creation from GSC and GA4 is viable for one to two clients, not for an agency at scale
- Best use: internal analysis and as the data foundation layer for a paid reporting tool. Not suitable as standalone client deliverables
What Metrics Should Be Included in Your SEO Reporting Dashboard?
Effective SEO reporting dashboards organize metrics into four categories: visibility (rankings and impressions), traffic (organic sessions and user behavior), engagement (click-through rate and pages per session), and conversions (leads, revenue, and cost per acquisition). This hierarchy prioritizes business outcomes over technical metrics and ensures the most important data appears first in client reports.
|
Category |
Metric |
Source Tool |
Why It Matters |
|
Visibility |
Keyword rankings |
Rank tracker / GSC |
Leading indicator for traffic |
|
Visibility |
Search impressions |
Google Search Console |
Measures total market reach |
|
Visibility |
CTR by position |
Google Search Console |
Identifies title/meta opportunities |
|
Traffic |
Organic sessions |
Google Analytics 4 |
Quantifies audience growth |
|
Traffic |
New vs. returning users |
Google Analytics 4 |
Signals brand authority |
|
Engagement |
Pages per session |
Google Analytics 4 |
Content relevance indicator |
|
Engagement |
Dwell time |
Google Analytics 4 |
Ranking quality signal |
|
Conversions |
Qualified leads from organic |
GA4 + CRM |
Direct pipeline contribution |
|
Conversions |
Cost per acquisition |
GA4 + CRM |
ROI justification metric |
|
Conversions |
Revenue attributed to organic |
GA4 + CRM |
Closes the budget argument |
Why Conversion Attribution Matters More Than Rankings
Rankings are a leading indicator. Conversions are the business outcome. A client who understands that a ranking improvement in month three will produce traffic growth in month four and lead growth in month five is a client who does not cancel the retainer at month four when traffic has not yet moved.
The mechanics of conversion attribution: configure GA4 conversion events for form submissions, demo requests, phone calls, and purchases. Assign revenue values to each. Use UTM parameters consistently across all organic content to distinguish organic sessions from direct and referral traffic. Connect GA4 to your CRM to track leads from organic first-touch through to closed deal. When you can show a client that ‘ranking for keyword X generated 4 qualified leads representing $320,000 in pipeline,’ the conversation about SEO value never needs to happen again.
How Should You Implement SEO Reporting for Maximum Client Impact?
Implementation success depends on three steps: aligning dashboard KPIs with each client’s specific business outcome, automating report scheduling to eliminate manual production, and onboarding clients on metric interpretation so they understand what they are looking at without requiring a monthly walkthrough.
The implementation sequence:
- Step 1: Discovery call to identify the client’s primary business outcome. Is the goal qualified leads, e-commerce revenue, phone calls, or brand awareness? The answer determines which conversion events to configure and which metrics to lead with in the report.
- Step 2: Map SEO metrics to client KPIs. Organic traffic volume maps to lead volume at the client’s conversion rate. Keyword rankings for commercial terms map to future traffic growth. Backlink acquisition maps to domain authority improvement and ranking sustainability.
- Step 3: Configure dashboard with the agreed-upon metrics and white-label branding. Hide or deprioritize metrics the client does not need to see: a local service business does not need a backlink authority score in their monthly report.
- Step 4: Set automated reporting schedule. Monthly is standard for most clients. High-priority accounts may warrant weekly ranking updates. Automate delivery to the client’s inbox.
- Step 5: Host a 30-minute onboarding session to walk through the dashboard. The goal is for the client to be able to read their own dashboard without assistance. A client who can monitor their own progress between monthly reports is less anxious, asks better questions, and stays longer.
Always include narrative context alongside data. A dashboard showing 23% YoY traffic growth is informative. A report that says ‘traffic grew 23% year-over-year, which adds approximately 14 additional qualified leads to your pipeline at your current conversion rate’ is actionable. The numbers need a sentence.
How Firestarter’s Client Dashboard Sets the Reporting Standard
Firestarter’s reporting model is built around a single principle: clients should never have to ask whether their SEO is working. The reporting and conversions framework provides two layers of transparency: 24/7 real-time dashboard access to campaign data, and custom monthly reports that add the narrative context and strategic direction that raw data cannot provide on its own.
What the Firestarter dashboard tracks and reports:
- Keyword rankings updated regularly and compared against competitors, not just a static position snapshot
- Organic traffic broken down by source, with month-over-month and year-over-year comparisons to account for seasonal patterns
- Three conversion types tracked as standard: form submissions, website phone calls, and Google Business Profile calls. Additional conversion events configured per client goals.
- Link acquisition: new links earned, referring domains added, and authority score progression
- Task reporting: every action taken within the campaign is documented and visible, so clients understand the work, not just the results
The distinction from generic reporting tools is the attribution layer. Rather than showing traffic and conversions in separate reports, Firestarter connects the chain: keyword ranking improvement to organic traffic increase to lead volume change to revenue impact. That end-to-end view is what the conversions report is specifically designed to deliver. As Firestarter’s reporting page notes, ‘The conversion report is perhaps the most important. Here you can measure the ROI of your SEO investment.’
How This Differs from Generic Analytics Tools
- General BI tools like Tableau or Looker Studio require technical configuration to connect data sources and build visualizations. They are powerful but not designed for non-technical client stakeholders
- Full-suite platforms like Semrush and Ahrefs report to the analyst. Firestarter’s dashboard reports to the business owner: what is happening, why it matters, and what the plan is for next month
- The monthly report adds the interpretation layer that a live dashboard cannot: context for anomalies, explanation of algorithm updates, and a forward-looking action plan rather than backward-looking documentation
What Questions Should You Ask Before Choosing an SEO Reporting Tool?
Before committing to a reporting platform, evaluate it against these eight questions. The answers will surface whether the tool is designed for your workflow or whether you will be adapting your workflow around the tool’s limitations.
- Does it offer white-label customization with your agency domain and branding, or does it display the tool vendor’s brand to your clients?
- Can reports be scheduled and sent automatically, or do you manually generate and export each month?
- What data sources does it pull from, and are they first-party connections (direct Google API) or aggregated third-party estimates?
- Does it support conversion and revenue attribution, or is it limited to rankings and traffic volume?
- What is the cost per client, and does the pricing model stay profitable as you add clients?
- What is the setup time per new client: under an hour with pre-built templates, or a multi-day integration project?
- Can you customize metrics and reporting thresholds to match client-specific business goals, or are you locked into a fixed template?
- Does the vendor provide client onboarding materials, or are you building your own training documentation from scratch?
Frequently Asked Questions
What is the difference between rank tracking and SEO reporting dashboards?
Rank tracking monitors keyword position changes in search results. An SEO reporting dashboard combines rankings with traffic data, conversion metrics, backlink monitoring, and business outcome attribution to show complete campaign impact. Rank trackers are analyst tools; reporting dashboards are client communication tools. The best setups use both: a rank tracker feeds position data into the dashboard alongside GA4 and GSC.
Can I use Google Search Console instead of a paid SEO reporting tool?
Google Search Console is the most authoritative source for organic search data and should be the foundation of any reporting system. However, it lacks automated reporting, white-label branding, and cross-platform data integration. It is the right tool for internal analysis. For client-facing reporting at any scale, a paid tool that pulls from GSC via API and adds automation is necessary.
How often should SEO reports be sent to clients?
Monthly reporting is standard for most clients and matches the natural rhythm of SEO campaigns, where significant changes take four to eight weeks to appear in data. High-priority accounts or clients early in their campaign may benefit from weekly ranking updates to maintain confidence during the ramp period. Automated scheduling ensures consistency and eliminates the manual production overhead.
What should I do if a client’s rankings drop but traffic increases?
This is a CTR story, not a ranking problem. Rankings may have dropped for lower-volume terms while improving for higher-volume terms, or the CTR improvement from a title/meta rewrite is driving more clicks from the same or lower positions. A good dashboard surfaces this by showing impressions and CTR alongside position data, not just position alone. Use the data to redirect the conversation from rank movement to traffic and conversion outcomes.
Is white-label reporting worth the investment for small agencies?
Yes, for any agency managing 10 or more clients. White-label dashboards reinforce professional credibility and justify retainers by showing ongoing optimization activity between monthly reports. The time savings from automated report generation typically exceed the tool cost within the first month for agencies that were previously producing reports manually.
Which metric matters most for client reporting: rankings, traffic, or conversions?
Conversions always take precedence. Revenue and qualified lead volume directly answer whether SEO is producing returns. Traffic confirms that improved rankings are translating into audience reach. Rankings are a leading indicator that predicts future traffic. Lead with conversions in every client report and build backwards: these conversions came from this traffic, which came from these ranking improvements.
Build a Reporting System That Justifies Your SEO Investment
The right SEO reporting dashboard does more than aggregate data. It shows clients a clear line from search visibility to closed revenue. Firestarter’s reporting system, combining 24/7 dashboard access with monthly narrative reports, is built to make that connection visible from day one. To see how Firestarter structures campaign measurement and reporting, request a free proposal now.