Setting up and confirming Google Analytics tracking is a chore in and of itself. Once you have analytics set up, how do you know which metrics are important? We will talk about the different types of data you will see in your reports and analytics profile here.

Realtime Statistics
The first report statistic in the Google Analytics system is real-time user information. This gives you a snapshot of the users currently interacting with your website. This lets you explore important insights as they occur. If you have a large company with differentiation of powers, you can audit workflows and the sales process for users live on the site. Realtime statistics also show locations for the users interacting with your site. You can explore well-performing content, conversions, and much more real-time.
Audience Tracking
This metric allows you to explore your audience over a period of time you would like to specify. You can develop a game plan from statistics like demographics, interests, geological location, and more. You are also able to see how certain pages performed within the date range selected. This is the statistic we probably use the most. You are able to filter out certain traffic sources if you only want to look at specifics like organic search, paid advertisements, referral traffic, and more. You can even create your own custom metrics to track your traffic in the ways you would like to see.
User Acquisition
User acquisition statistics are another great way to see detailed data about the users interacting with your website. As is in the name, acquisition tracks the way in which your website acquired the users. This metric reports the type of traffic that has come into your website over a specified period of time. Here is an example of how our user acquisition data is displayed when looking at the acquisition overview:
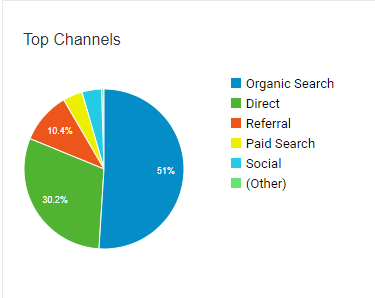
As you can see, this gives you a pie chart with a legend to determine how your traffic came in. We are sitting at just over half of our traffic coming from Organic Search, about a third coming from direct traffic, and then a few other traffic sources follow thereafter. This can be a great tool to understand where your traffic is coming from and which type of traffic may need some TLC.
User Behavior & Conversions
The last two metrics in your analytics profile are user behavior and conversions. User behavior lets you see how the users interacting with your site navigate throughout. You are able to see your most popular pages and many statistics related to each. You are also able to explore the pages where users exited. This allows you to see the pages which could use some work. If most of your users drop off on one page, you may give some time to making that page perform better. Lastly, we have conversions. These are the direct metrics you are viewing as conversions. The possibilities for conversion tracking are nearly endless. Whether you are looking to track form fill outs, page views, phone calls, video views, or just about anything else, analytics has a solution for you.
As you can see, there is a large amount of data you can utilize from your Google Analytics profile. If you’d like to learn more about monitoring your traffic, contact us today.